
The most powerful — and most widely misunderstood — force in equity markets.
Price-to-Sales compression is the long-term, systematic decline in the valuation multiple that investors are willing to pay per dollar of a company's revenue.
The phenomenon also manifests as Price-to-Earnings compression, Price-to-Free-Cash-Flow compression, and Price-to-Tangible-Equity compression. The mechanics are identical across all ratio types: the numerator (price) fails to keep pace with the denominator (the fundamental metric), because the market is progressively repricing what a dollar of that fundamental is worth.
The core paradox is this: a company can execute brilliantly — tripling, quadrupling, even growing revenues 34x — and shareholders can still earn nothing, or even lose money, over periods of 10 to 17+ years. The business wins. The investor loses. The explanation is always the same: the starting valuation was too high, and the compression in the multiple consumed all of the wealth that the business created.
"The quality of the business and the quality of the investment are two entirely separate questions. A magnificent business bought at the wrong price can deliver zero returns for an entire generation."
Early in a company's life cycle — or during a period of explosive growth — investors become excited about future prospects. They extrapolate current growth rates forward and assign enormous premiums to each dollar of current revenue. A company growing revenues at 40–50%+ annually gets priced as though that trajectory will continue indefinitely. The P/S ratio climbs to 10, 15, 30, even 35+.
But growth rates are inherently self-limiting. As companies scale, the law of large numbers takes hold. A company doing $1 billion in revenue can plausibly double in a year. A company doing $50 billion cannot. As the growth rate decelerates — even while absolute revenue continues climbing impressively — the market systematically ratchets down the premium it assigns. The P/S ratio doesn't just drift lower; it compresses dramatically, often by 80–95%+.
This isn't random. It's a measurable, predictable, statistical pattern — as reliable as gravity. Market capitalization cannot sustainably exceed the Net Present Value of a company's future profits. When it does, the excess is a statistical anomaly that will eventually correct. The only question is how long it takes.
The following reports illustrate P/S compression across different eras, industries, and growth trajectories — yet the outcome is strikingly uniform. Five different companies. Five different industries. Five different decades. And in every case, the business grew dramatically while the stock went essentially nowhere for years.
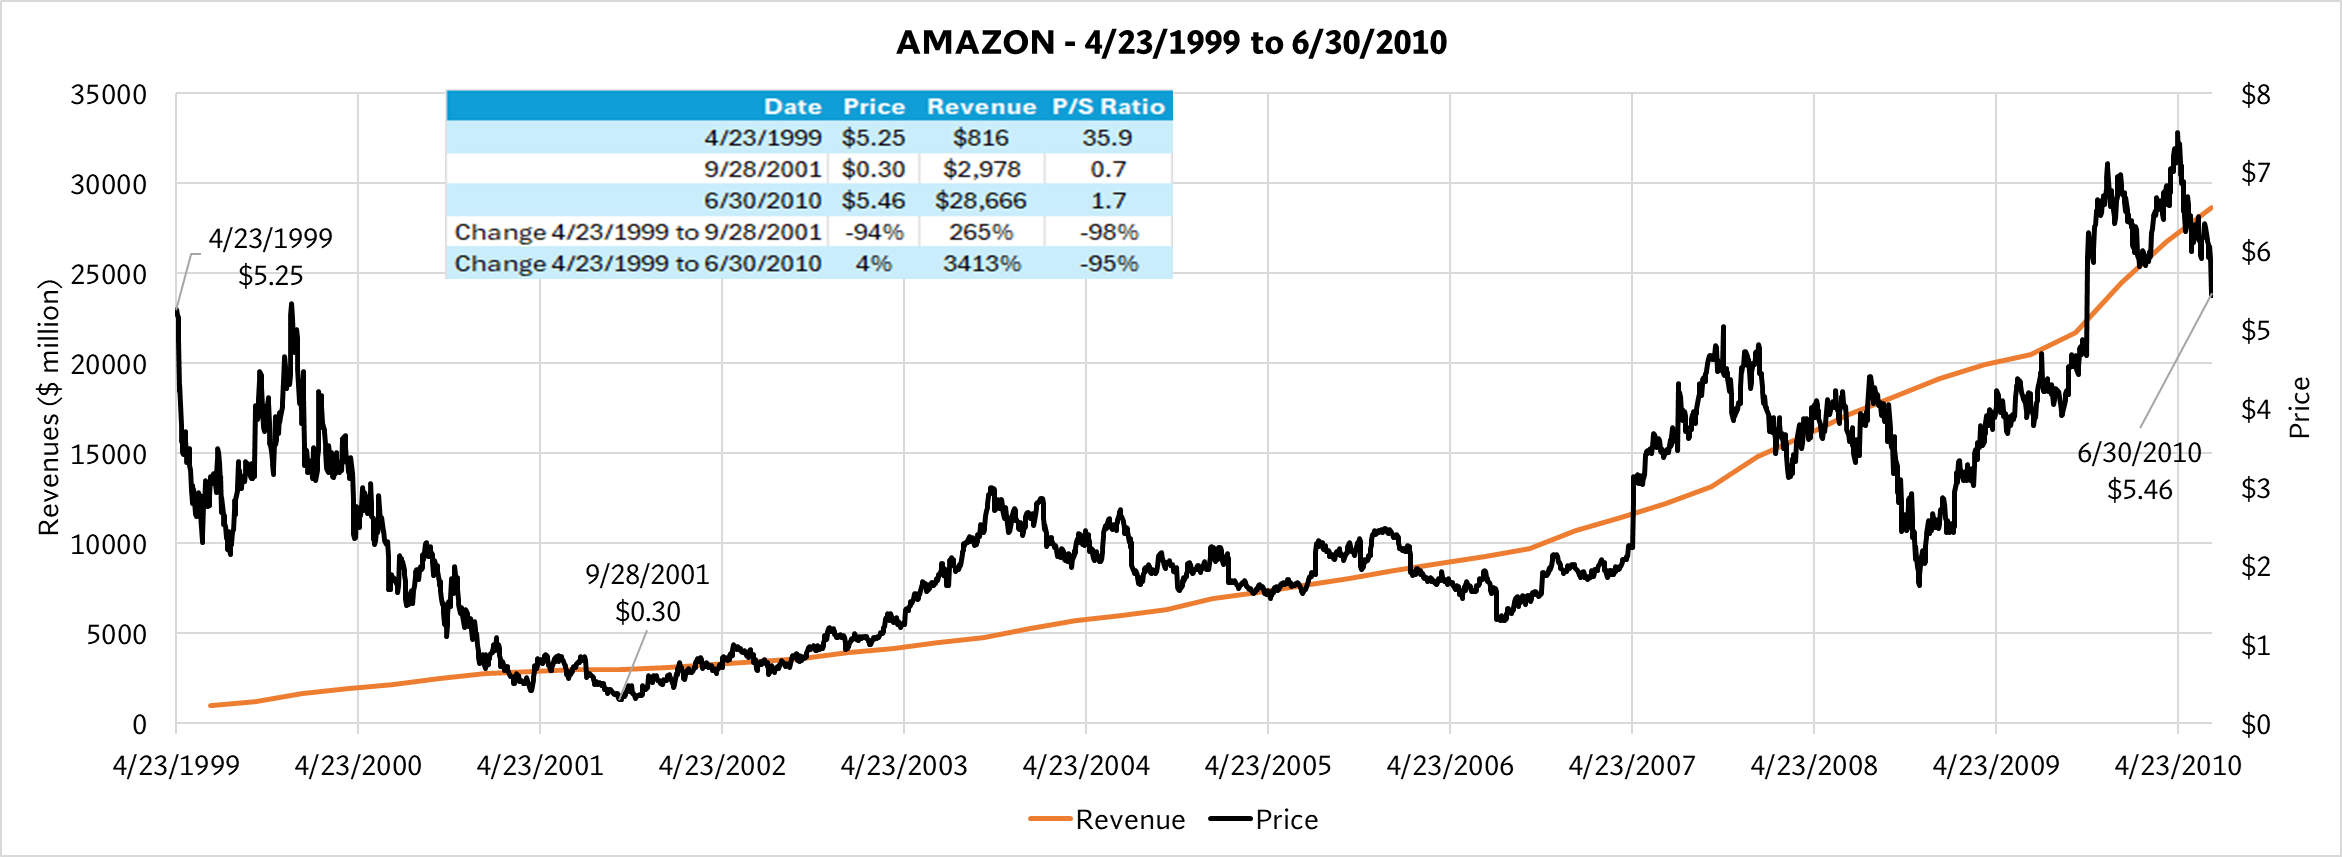
April 1999 – June 2010 · 11 Years
Amazon grew revenues an astonishing 3,413% over 11 years — from $186 million to over $28 billion — building what would become the most dominant e-commerce and cloud platform on Earth. Yet the stock returned just 4% over the entire period.
The P/S ratio collapsed from 35.9 to 1.7 — a compression of 95%. Investors went from paying $35.90 per dollar of Amazon's sales to paying $1.70. Along the way, the stock fell 94% to $0.30 during the dot-com crash. The business was spectacular. The investment was not.
Click chart to download full report (PDF)
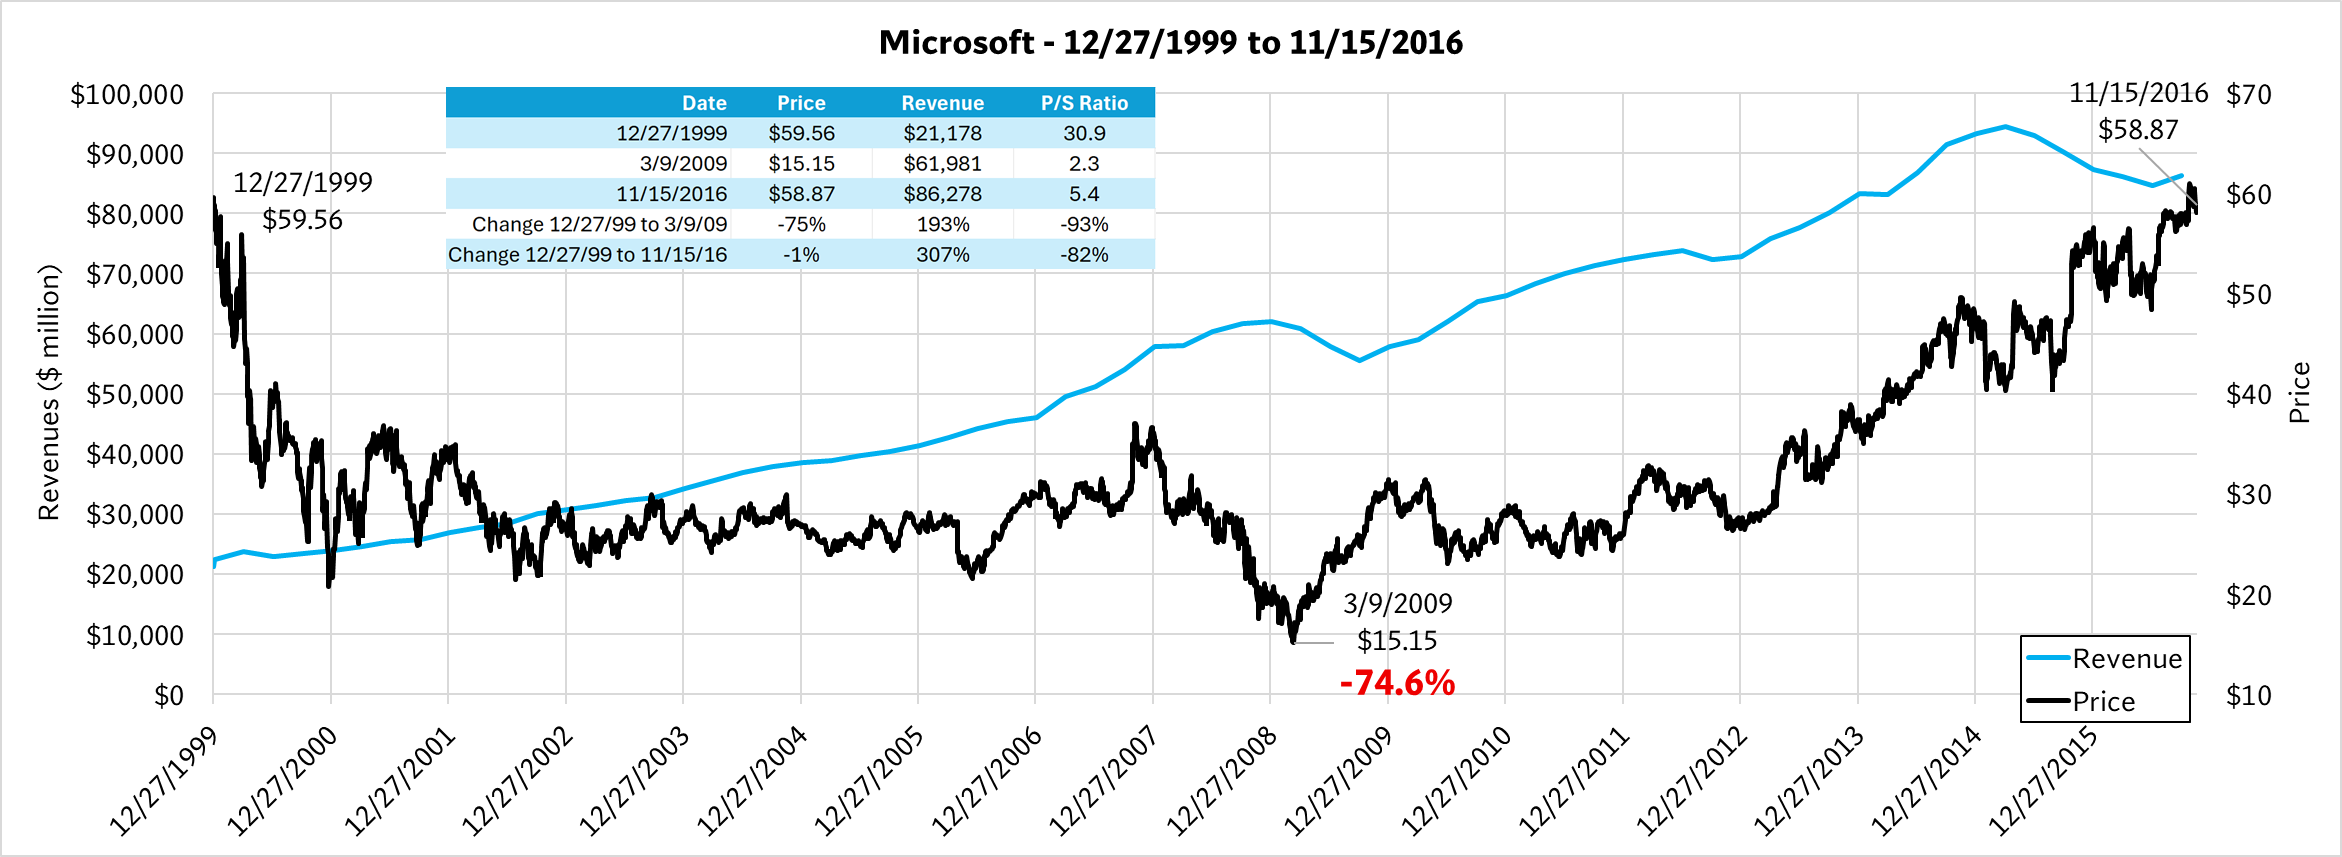
December 1999 – November 2016 · 17 Years
Microsoft more than quadrupled revenues over 17 years — growing 310% from $21 billion to $88 billion — dominating enterprise software and building Azure into a cloud powerhouse. Yet the stock returned approximately 0% over the entire period.
The P/S ratio fell from 30.9 to 5.4 — a compression of 83%. An investor who bought Microsoft at its 1999 peak had to wait until 2016 — through the War on Terror, the financial crisis, the smartphone revolution — just to break even. At its 2009 low, the stock had lost 74.6%. That's an entire generation of dead money in one of the greatest businesses ever built.
Click chart to download full report (PDF)
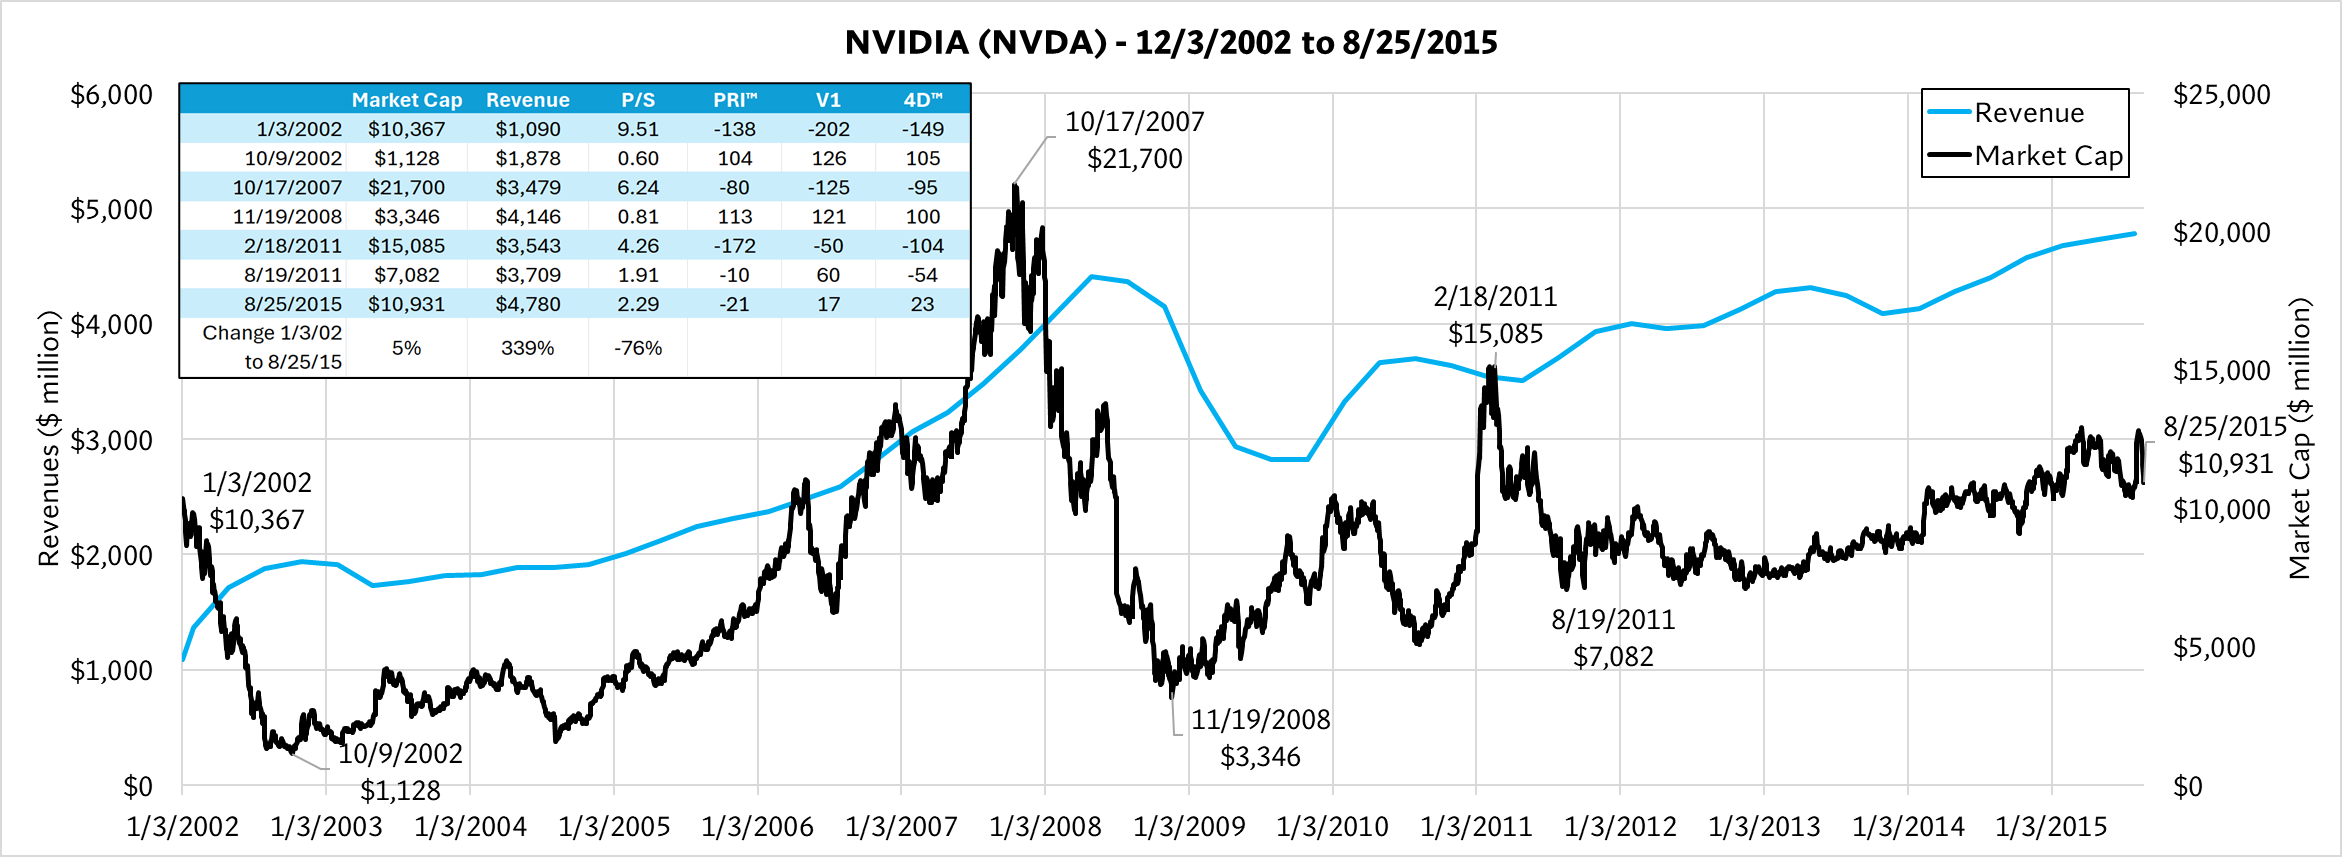
December 2002 – August 2015 · 13.5 Years
NVIDIA grew revenues 339% over 13.5 years, establishing itself as the dominant force in GPU computing and laying the groundwork for the AI revolution. Yet the stock returned just 5% over the entire period — barely above breakeven across more than a decade.
The P/S ratio underwent severe compression — declining approximately 76%. The market cap peaked at $21,700 in October 2007 before crashing to $3,346 in November 2008, a drawdown of over 84%. NVIDIA's technology was transforming entire industries. Its shareholders saw almost none of the benefit for 13 years.
Click chart to download full report (PDF)
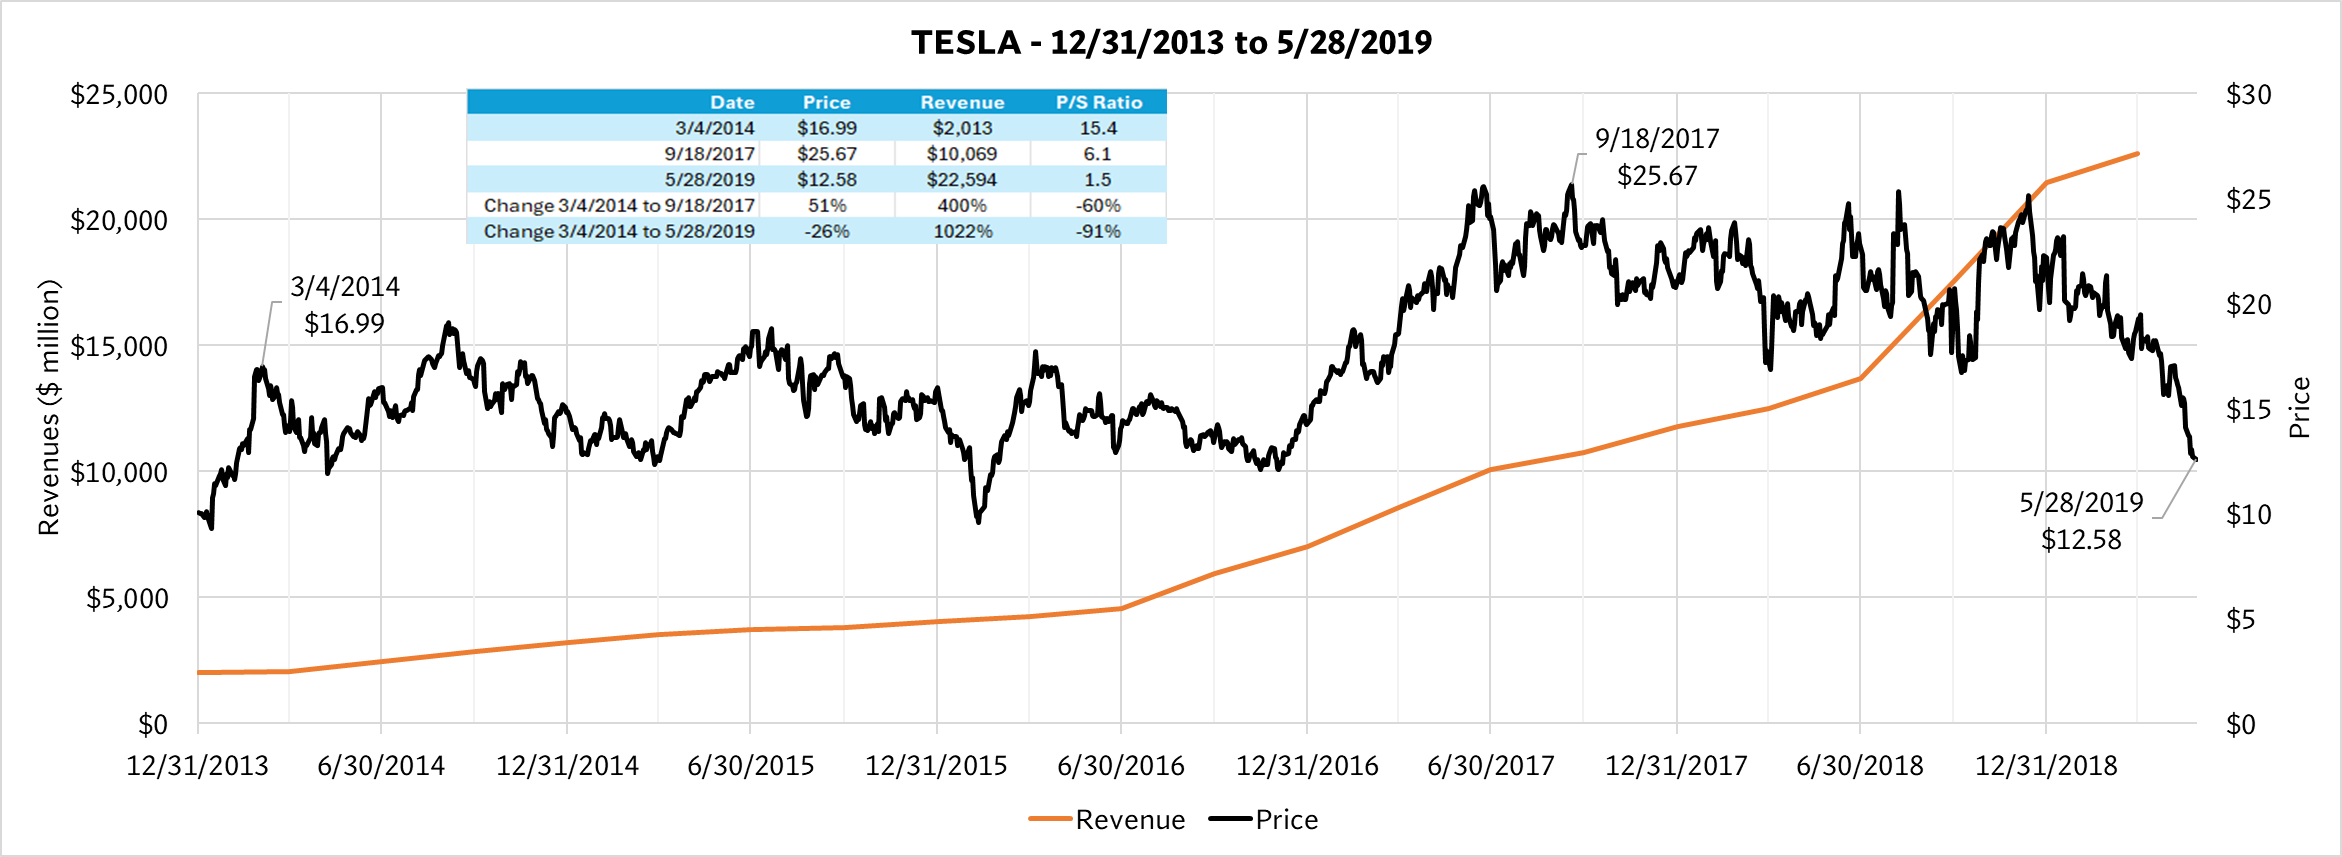
December 2013 – May 2019 · 5 Years
Tesla grew revenues over 1,022% in just 5 years — from $2 billion to over $22 billion — revolutionizing the automotive industry and proving that electric vehicles could achieve mass-market scale. Yet the stock lost 26% over the same period.
The P/S ratio fell from 15.4 to 1.5 — a compression of 91%. Tesla's case is especially striking because it demonstrates that even the most disruptive company in the most transformative industry of its era could not outrun the mathematics of P/S compression. Revenue grew tenfold. The stock went down.
Click chart to download full report (PDF)
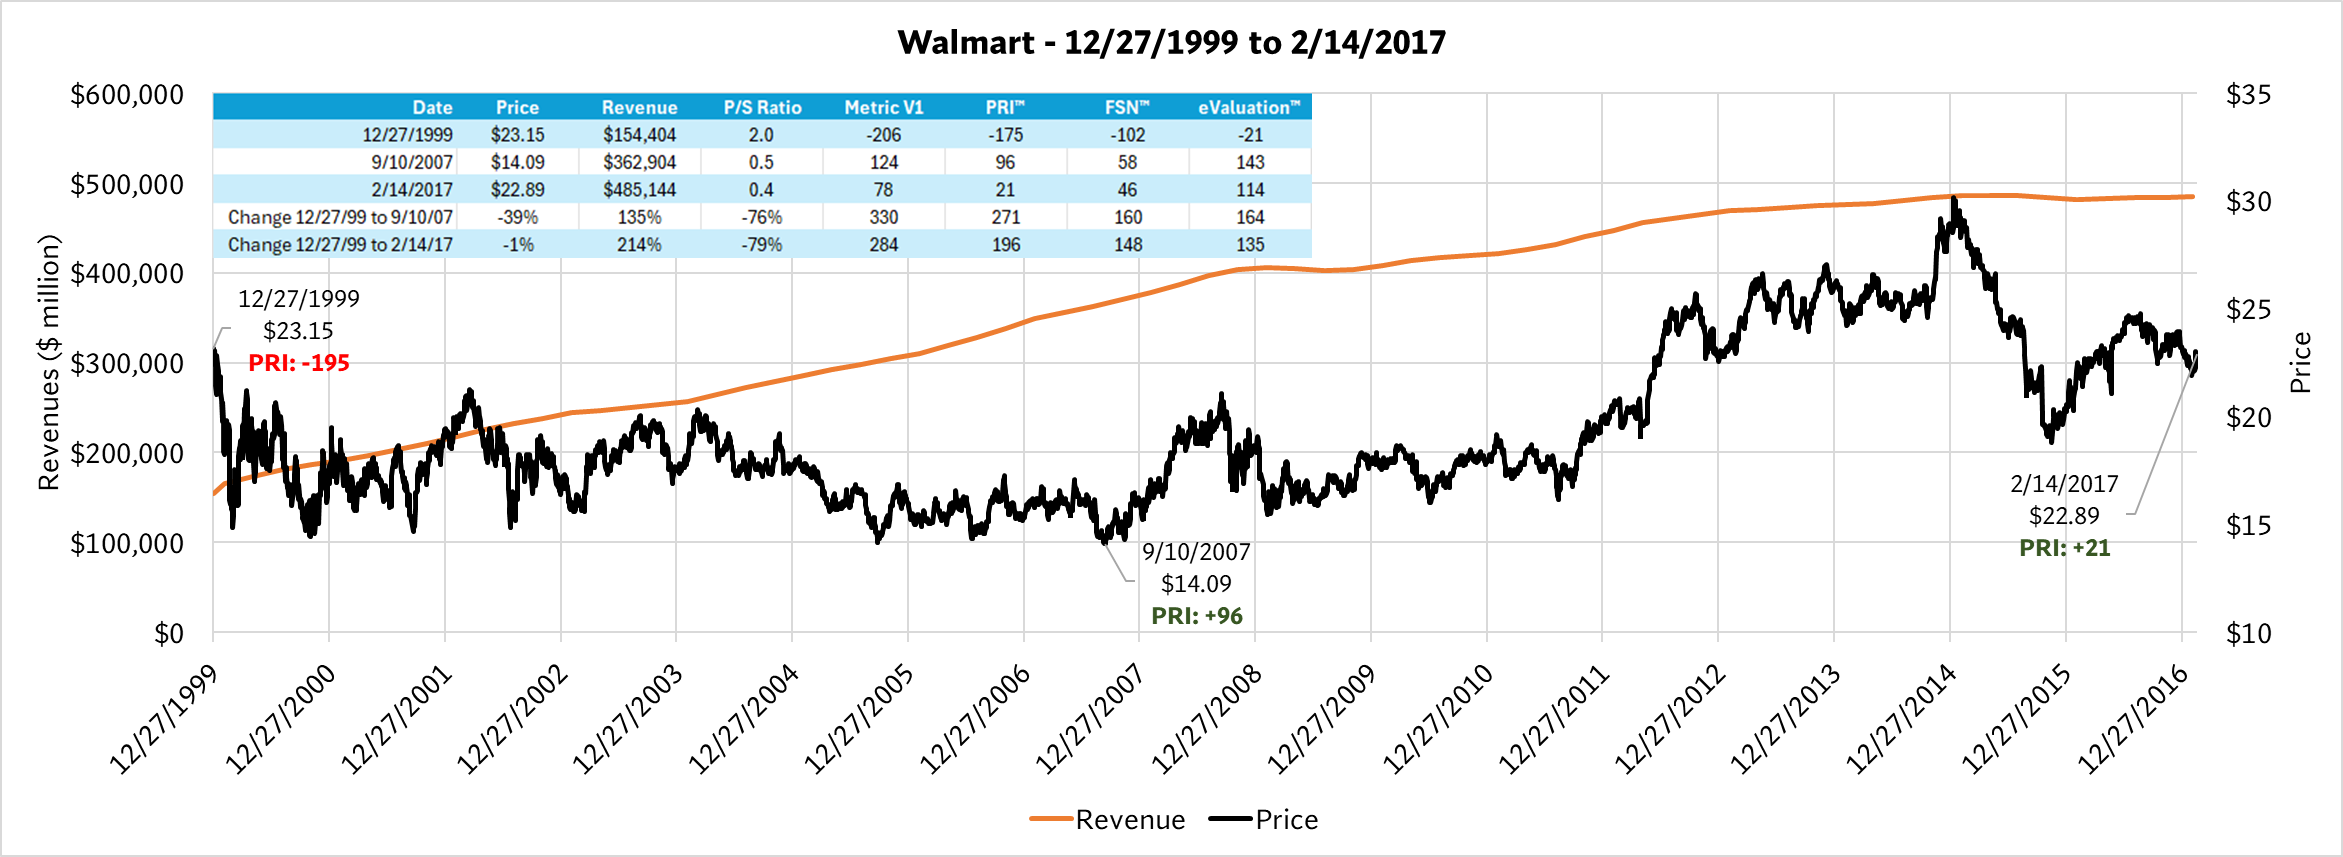
December 1999 – February 2017 · 17 Years
Walmart more than tripled revenues over 17 years — growing 214% from $154 billion to $485 billion — cementing its position as the world's largest retailer. Yet the stock finished 1% lower than where it started.
The P/S ratio fell from 2.0 to 0.4 — a compression of 79%. Walmart's case is particularly instructive because a starting P/S of just 2.0 doesn't look extreme — but for a mature retailer of that size, it was. Investors decided they would pay roughly one-fifth as much per dollar of Walmart's revenues. Revenues went up threefold. The going rate went down fivefold. The price didn't move.
Click chart to download full report (PDF)
ERS risk ratings identify the statistical probability and magnitude of stock price changes —
including the valuation compression that Wall Street ignores.